6.3 Plot Maps
- We can also plot the data on a map 6.5
world = map_data("world")
w1 = ggplot() + geom_polygon(data = world, aes(color = region, x = long, y = lat,
group = group), fill = "white") + theme_map() + theme(legend.position = "none") +
scale_fill_brewer(palette = "Blues")
map1 = w1 + geom_point(aes(x = Long, y = Lat, size = Cases, colour = Country), data = d2) +
labs(title = "COVID-19 Cases")
# static version
map1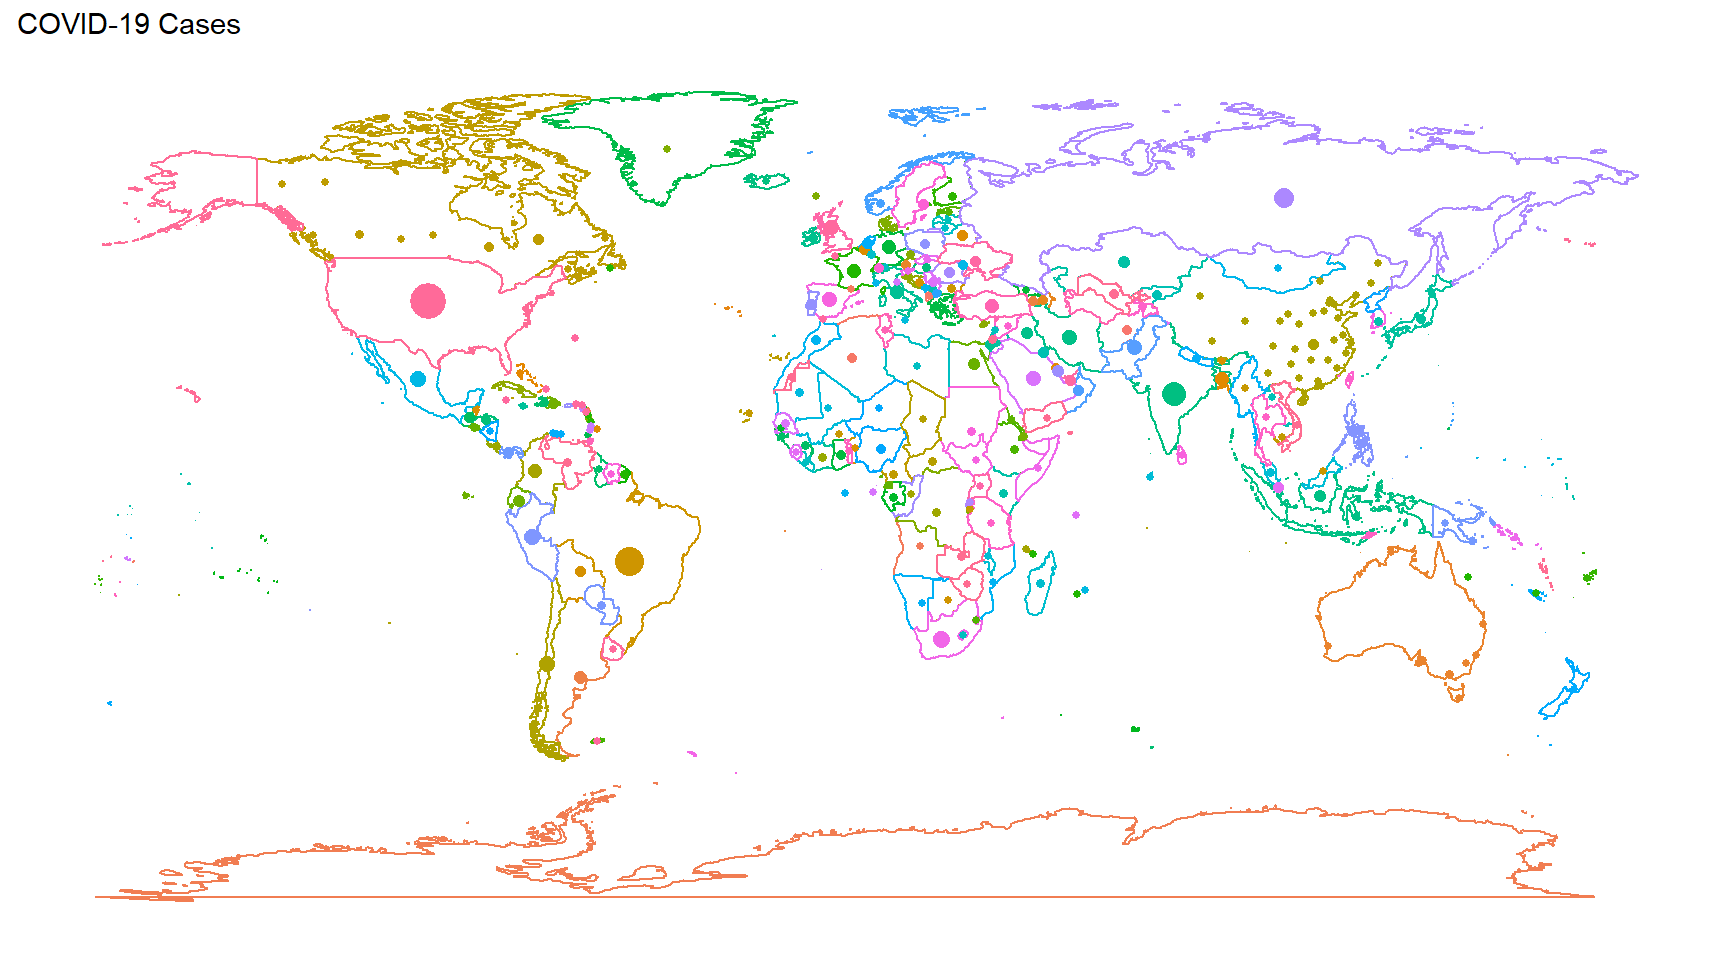
Figure 6.5: Map
- Interactive version using plotly 6.6
Figure 6.6: Interactive Map