5.2 R Graphical Parameters
The \(\mathtt{par}\) function facilitates access and modification of a large list of parameters such as color, margin, number of rows and columns on a graphic device etc (see \(\mathtt{help(par)}\) for a list of such parameters).
R provides various margin parameters to tweak inner and outer margins of a graphical device.
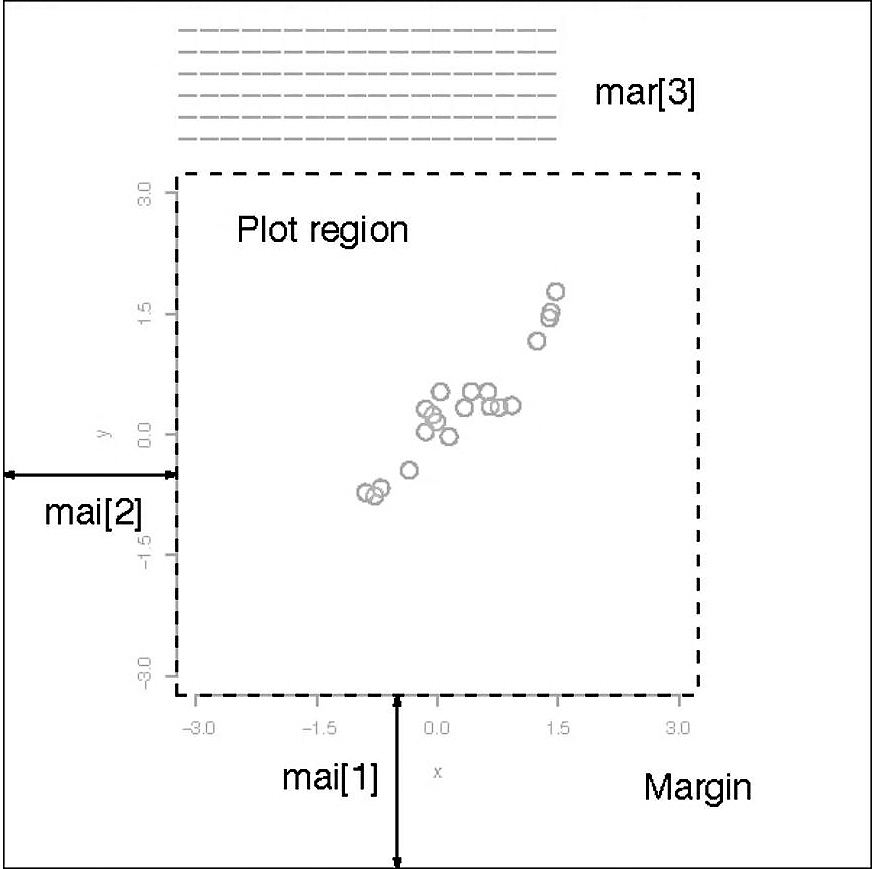
Figure 5.10: Graph Margins
A modification to par always changes the global values of graphic parameters and hence its is a good practice to first store the default parameters in a separate object (variable) which can be later used to restore default graphic parameters.
These margins can be altered using or parameters with the first setting the margins in inches and the second in unit of text lines. Setting one of these will adjust the other accordingly.
The following example (output not shown here) changes the margins to \(\mathtt{c(5,4,7,2)}\) from the default of \(\mathtt{c(5,4,4,2)+0.1}\) to accommodate a title on top of the figure.
# first save the default parameters
par.old = par()
# change the margins
par(mar = c(5, 4, 7, 2))
# plot the bargraph
barplot(height = data[1:5, ], beside = FALSE, col = rainbow(5), legend = rownames(data[1:5,
    ]), args.legend = list(x = "top", horiz = TRUE, inset = -0.1), cex.names = 0.6)
title("Bar Plot \n(with custom margins)")
# set parameters to default
par(par.old)- A multiple plot grid can be created by altering \(\mathtt{mfrow}\) or \(\mathtt{mfcol}\) parameter which specifies the number of rows and columns in a grid.
# first save the default parameters
par.old = par()
# creat a 2X2 grid
par(mfrow = c(2, 2))
# scatterplot
plot(x, y, xlab = "Normal X", ylab = "Normal Y")
# time series plot
plot(FinData.ts[, 1])
# bar plot
barplot(height = GDP$Australia, names.arg = GDP$Year, ylab = "GDP Per Capita (Australia)")
# pie chart
pie(x = data[1:11, 1], labels = rownames(data[1:11, ]))
# set parameters to default
par(par.old)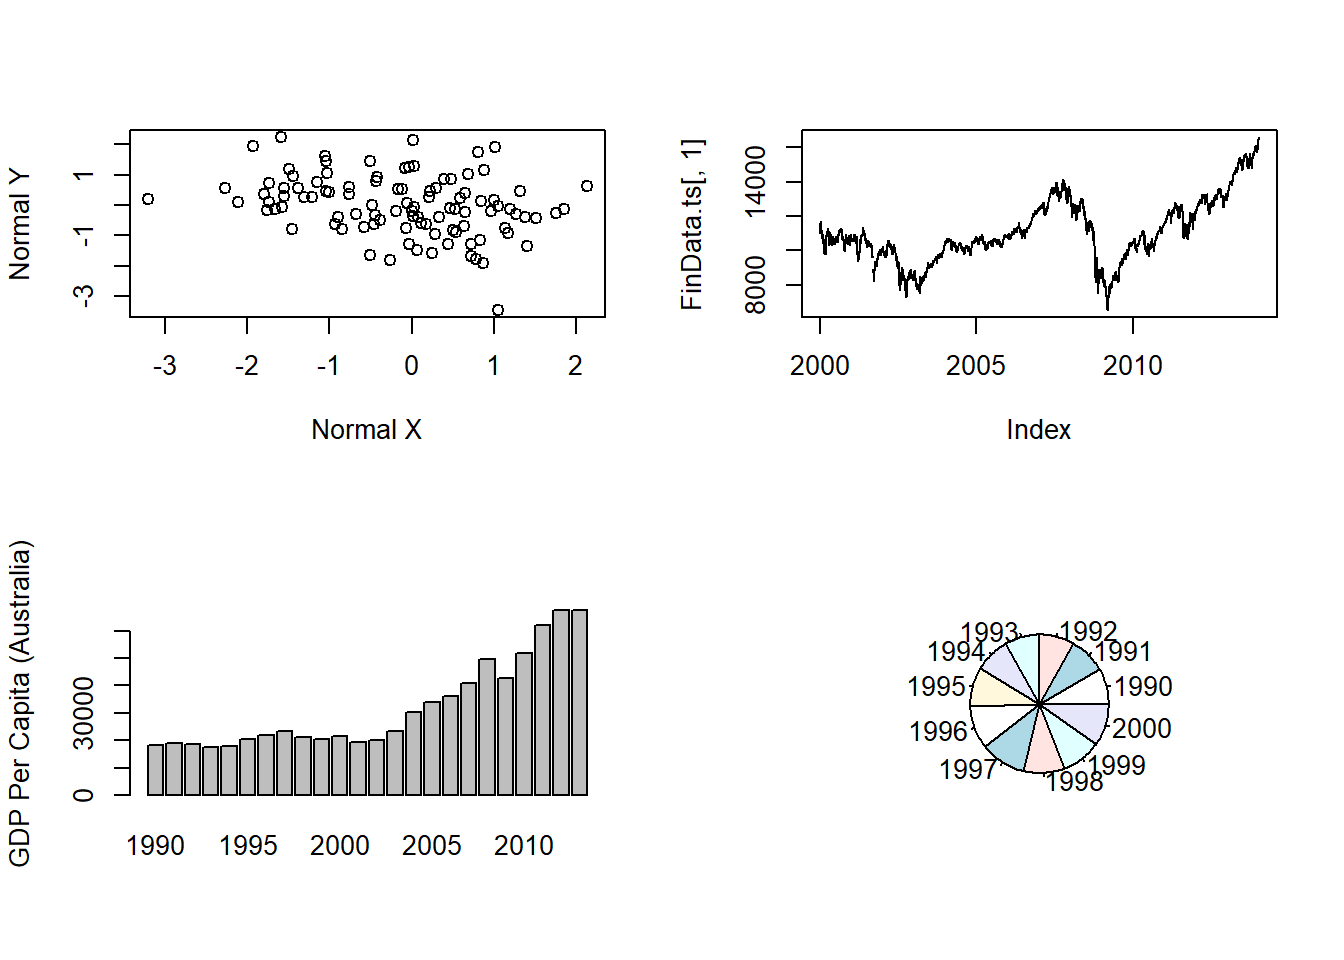
Figure 5.11: Multiple Plots in a Grid